I’ve spent the last few weeks working with the security architecture of the nRF54L series from Nordic Semiconductor (in case you missed it, I recently joined Nordic!). While doing so, I have engaged my typical low-level learning technique of eschewing writing firmware for manually poking at registers using the debugger. A few nights ago I found myself observing unexpected values in memory when working with the key management unit. It turned out to be a familiar issue, but one that requires an understanding of the internal system on chip (SoC) components, and how the debugger interacts with them, to diagnose.
For a bit of background, the nRF54L series has a fairly advanced set of security capabilities, headlined by Arm TrustZone support in the Cortex-M33 core, a CRACEN cryptographic accelerator, and a Key Management Unit (KMU). The KMU is used for storing sensitive data, such as key seeds and associated metadata, in the Secure Information Configuration Region (SICR).
The SICR is divided into slots. These slots are targeted by issuing tasks to the
KMU, which can only be accessed in secure mode. Typically, application firmware
doesn’t interact with the KMU directly. Instead, PSA
drivers are implemented
to abstract the generation, storage, and usage of keys. For example, if
invoking
psa_generate_key(),
the operation eventually results in a call to
import_key_for_kmu()
in the CRACEN PSA
driver.
static psa_status_t import_key_for_kmu(const psa_key_attributes_t *attributes, const uint8_t *data,
				       size_t data_length, uint8_t *key_buffer,
				       size_t key_buffer_size, size_t *key_buffer_length,
				       size_t *key_bits)
{
	size_t opaque_key_size;
	psa_status_t status = PSA_ERROR_CORRUPTION_DETECTED;
	int slot_id =
		CRACEN_PSA_GET_KMU_SLOT(MBEDTLS_SVC_KEY_ID_GET_KEY_ID(psa_get_key_id(attributes)));
	psa_key_attributes_t stored_attributes;

	status = cracen_get_opaque_size(attributes, &opaque_key_size);
	if (status != PSA_SUCCESS) {
		return status;
	}

	if (key_buffer_size < opaque_key_size) {
		return PSA_ERROR_BUFFER_TOO_SMALL;
	}

	status = cracen_kmu_provision(attributes, slot_id, data, data_length);
	if (status != PSA_SUCCESS) {
		return status;
	}

	status = cracen_kmu_get_builtin_key(slot_id, &stored_attributes, key_buffer,
						key_buffer_size, key_buffer_length);
	if (status != PSA_SUCCESS) {
		return status;
	}

	*key_bits = psa_get_key_bits(&stored_attributes);

	return status;
}
A slot can either be erased, provisioned, or revoked. The datasheet includes a helpful diagram of the state machine.
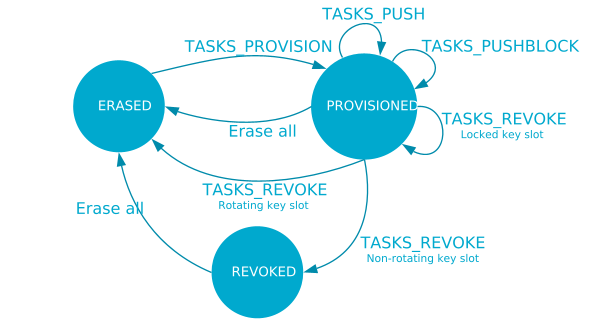
Slots have an ID (0 - 249) and can store metadata (32 bits), a destination
address (32 bits), a value (128 bits), and a revocation policy (2 bits). The
latter determines how state changes when a key is in the provisioned state and
various tasks that reference its slot ID are issued to the KMU. When
experimenting with the KMU, it is easiest to use the ROTATING revocation
policy, which dictates that the slot transitions back to the erased state when a
revoke task is issued.
When the PUSH task is issued, the value in the slot is written to the
destination address that was specified when the key was provisioned. The
provisioning process is documented in the
datasheet,
but it can also be seen in the cracen_kmu_key_slot_provision()
implementation:
static int cracen_kmu_key_slot_provision(const nrfx_kmu_key_slot_data_t *key_slot_data,
					 uint32_t slot_id)
{
	int kmu_status;
	uint8_t orig_write_buf_size;

	cracen_kmu_key_slot_provision_write_enable_set(true, &orig_write_buf_size);

	kmu_status = nrfx_kmu_key_slot_provision(key_slot_data, slot_id);

	cracen_kmu_key_slot_provision_write_enable_set(false, &orig_write_buf_size);
	return kmu_status;
}
The nrfx_kmu_key_slot_data_t definition can be found in the Nordic Zephyr
Hardware Abstraction Layer
(HAL).
typedef struct __PACKED
{
    uint32_t                     keyslot_value[KEY_SLOT_WORDS_COUNT]; ///< Key data to be provisioned.
#if NRF_KMU_HAS_REVOKE_POLICY || defined(__NRFX_DOXYGEN__)
    uint32_t                     revoke_policy;                       /**< Key revoke policy.
                                                                       *   @ref nrfx_kmu_rpolicy_t
                                                                       *   holds possible values. */
#endif
    uint32_t                     keyslot_dest;                        /**< Key slot destination when
                                                                       *   performing key push. */
#if NRF_KMU_HAS_METADATA || defined(__NRFX_DOXYGEN__)
    nrfx_kmu_key_slot_metadata_t metadata;                            ///< Metadata to write to keyslot.
#endif
} nrfx_kmu_key_slot_data_t;
You could write some fairly straightforward firmware, or even use the CRACEN KMU sample, build it, then flash it onto a development kit to easily provision a key to the KMU. However, if using the supported drivers (which you absolutely should), additional restrictions are placed on the values that you can use when provisioning a key slot. For example, while the KMU supports any 32 bit value for metadata, the PSA driver assigns meaning to each of the bits.
typedef struct kmu_metadata {
	uint32_t metadata_version: 4;
	uint32_t key_usage_scheme: 2;
	uint32_t reserved: 8;
	uint32_t algorithm: 6;
	uint32_t size: 3;
	uint32_t rpolicy: 2;
	uint32_t usage_flags: 7;
} kmu_metadata;
Similarly, there are restrictions on the values that you can write and the destination to which a given type of key is pushed. If manually interacting with the KMU, the metadata, value, and destination are much more flexible. However, if you provision non-conformant data into slots in the KMU, then attempt to interact with it using the supported drivers, you are going to have a bad time.
Knowing the risks, and that I could restore the SICR on nRF54LM20
DK with
an
ERASEALL
operation on the control access port
(CTRL-AP),
I had powered up the board and connected with
GDB. As previously mentioned, the
KMU can only be accessed in secure mode. However, when access port protection
is not
enabled,
the Secure Privileged Invasive Debug Enable
(SPIDEN)
signal is driven high, and the on-board J-Link debugger (J-Link
OB) can
operate with secure privileges.
With the CPU halted, I tested that I was able to access the KMU and determined
that it was ready for operations by reading from the STATUS
register
(0x50049400).
(gdb) x/1xw 0x50049400
0x50049400: 0x00000000
To test the actual functionality, I followed the
provisioning
and
push
steps described in the datasheet. The first step was to build the SRC data
structure in memory, which is of the format specified in the packed
nrfx_kmu_key_slot_data_t struct definition. To make testing multiple values
simpler, I wrote a tiny Python script to build the struct.
import struct

open("kmu_src.bin", "wb").write(
    bytes.fromhex("abc123abc123abc123abc123abc123ab")  # Value
    + struct.pack(
        "<III",
        3,  # Revocation Policy
        0x20000000,  # Destination Address
        0xDEF678DE,  # Metadata
    )
)
The produced kmu_src.bin contained the following contents.
xxd kmu_src.bin
00000000: abc1 23ab c123 abc1 23ab c123 abc1 23ab  ..#..#..#..#..#.
00000010: 0300 0000 0000 0020 de78 f6de            ....... .x..
To write the data to memory, I used the GDB restore command.
(gdb) restore kmu_src.bin binary 0x20001000
The next step was to write the address of the struct (0x20001000) to the KMU
SRC
register
(0x50049504) and specify the desired key slot (9) in the KEY_SLOT
register
(0x50049500).
(gdb) set *(unsigned int*)(0x50049504) = 0x20001000
(gdb) set *(unsigned int*)(0x50049500) = 9
Before actually issuing the task, the resistive random access memory controller
(RRAMC)
must be configured to allow unbuffered writes. I stored the current RRAMC
CONFIG
register
(0x5004e500) in a variable to be restored after completion of the task, then
wrote the value 1, which sets write enable (WEN) field to 1 and the buffer
size (WRITEBUFSIZE) to 0 (unbuffered).
(gdb) set $rramc_config = *(unsigned int*)(0x5004e500)
(gdb) set *(unsigned int*)(0x5004e500) = 1
Finally, I wrote 1 to the TASKS_PROVISION
register
(0x50049000), instructing the KMU to store the value and its metadata in key
slot 9. I verified the event was generated by subsequently reading the
EVENTS_PROVISIONED
register
(0x50049100).
(gdb) set *(unsigned int*)(0x50049000) = 1
(gdb) x/1wx 0x50049100
0x50049100: 0x00000001
With the task completed, I then reset the RRAMC CONFIG register.
(gdb) set *(unsigned int*)(0x5004e500) = $rramc_config
These exact operations can also be seen in the CRACEN PSA
driver’s
cracen_kmu_key_slot_provision() and the underlying
nrfx_kmu_key_slot_provision()
function.
static int cracen_kmu_key_slot_provision(const nrfx_kmu_key_slot_data_t *key_slot_data,
					 uint32_t slot_id)
{
	int kmu_status;
	uint8_t orig_write_buf_size;

	cracen_kmu_key_slot_provision_write_enable_set(true, &orig_write_buf_size);

	kmu_status = nrfx_kmu_key_slot_provision(key_slot_data, slot_id);

	cracen_kmu_key_slot_provision_write_enable_set(false, &orig_write_buf_size);
	return kmu_status;
}
int nrfx_kmu_key_slot_provision(nrfx_kmu_key_slot_data_t const * p_key_slot_data, uint32_t slot_id)
{
    NRFX_ASSERT((m_cb.state == NRFX_DRV_STATE_INITIALIZED) &&
                (p_key_slot_data) &&
                (slot_id < KMU_KEYSLOTNUM));

    bool is_ready = false;

    NRFX_WAIT_FOR(nrf_kmu_status_get(NRF_KMU) == 0, 500, 10, is_ready);

    if (!is_ready)
    {
        return -EAGAIN;
    }

    nrf_kmu_src_set(NRF_KMU, (uint32_t)p_key_slot_data);
    nrf_kmu_keyslot_set(NRF_KMU, slot_id);
    nrf_kmu_task_trigger(NRF_KMU, NRF_KMU_TASK_PROVISION_KEYSLOT);

    return wait_for_task_result(NRF_KMU_EVENT_EVENTS_PROVISIONED);
}
The push operation is significantly simpler, only requiring that the desired
slot be configured in the KEY_SLOT
register,
and the task be triggered by a write to the TASKS_PUSH
register
(0x50049004).
(gdb) set *(unsigned int*)(0x50049500) = 9
(gdb) set *(unsigned int*)(0x50049004) = 1
Similarly to the provision operation, I then checked the EVENTS_PUSHED
register
(0x50049104) to ensure the operation was successful.
(gdb) x/1wx 0x50049104
0x50049104: 0x00000001
With the EVENTS_PUSHED register indicating a successful operation, I finally
checked the destination address (0x20000000) that I had specified in the SRC
struct, which I expected to now hold the value.
(gdb) x/4wx 0x20000000
0x20000000: 0xab23c1ab 0xc1ab23c1 0x23c1ab23 0xab23c1ab
Pleased that I had successfully completed the operation, I attempted to repeat
the sequence of steps, this time using key slot 10 instead of 9, and 16
bytes of a def456 sequence instead of abc123 as the value. I issued the same
4 word read on 0x20000000 because I had reused the same destination address in
slot 10 as I had in slot 9. To my surprise the contents still matched the
previous value.
(gdb) x/4wx 0x20000000
0x20000000: 0xab23c1ab 0xc1ab23c1 0x23c1ab23 0xab23c1ab
This seemed rather peculiar, and my initial assumption was that I must have
missed a step when repeating the operation. However, no matter how many times I
attempted to push to same address (0x20000000), the value remained the same.
After erasing the device, I observed that the first push would correctly update
the value at the destination address, while subsequent pushes would not.
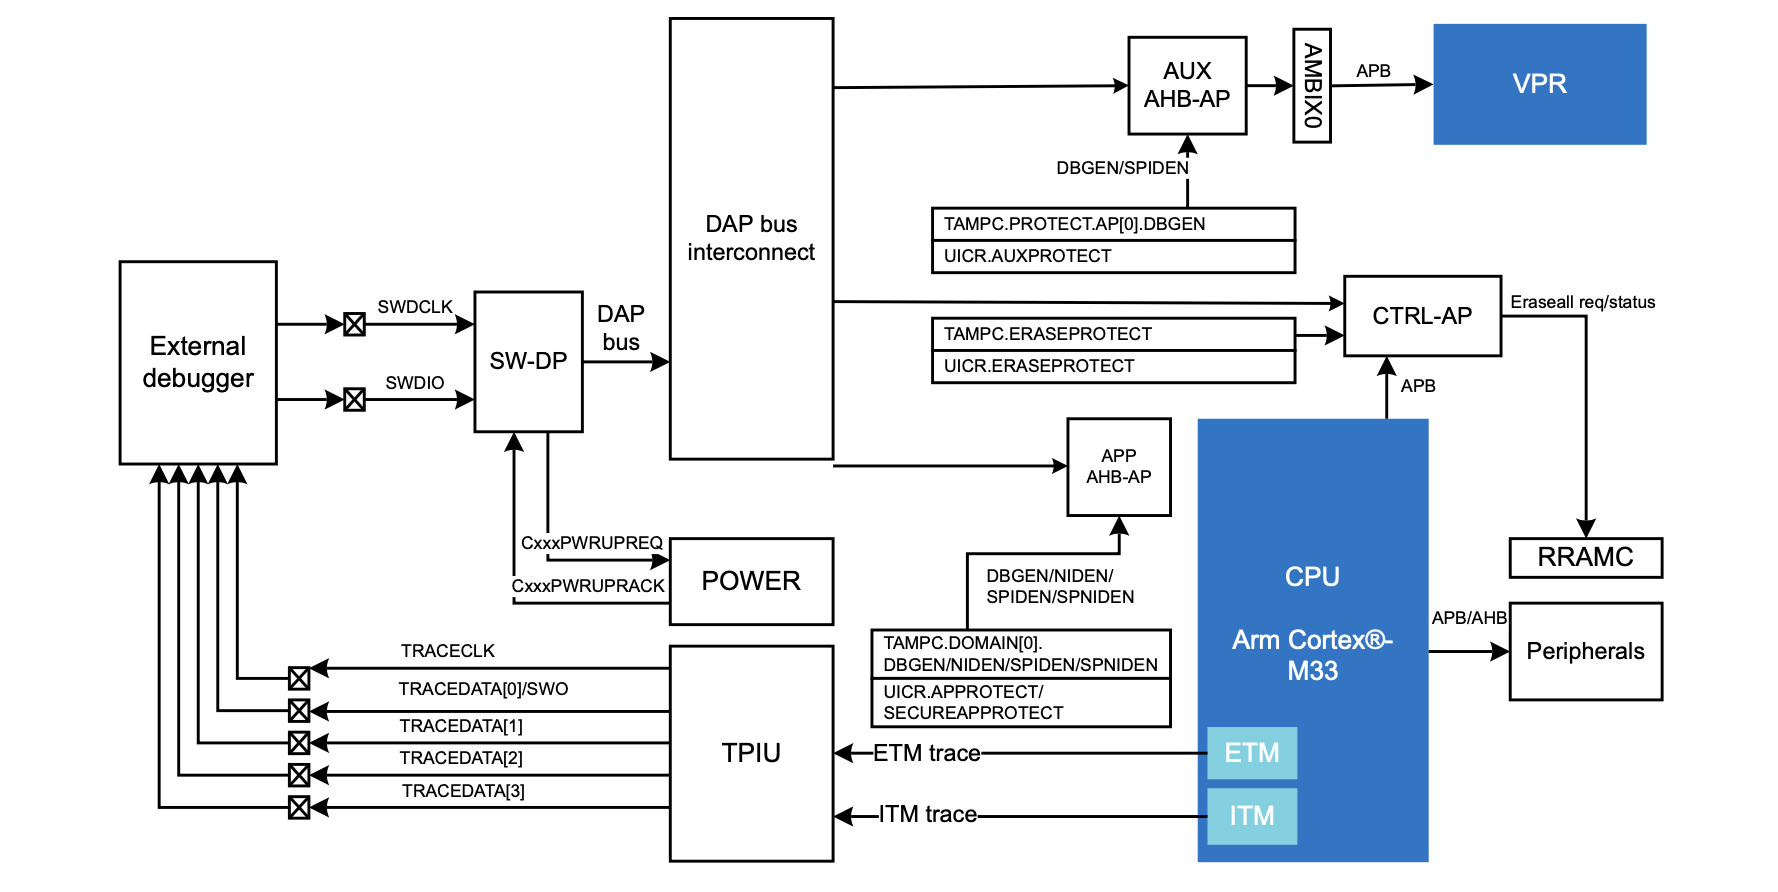
While astute readers may already be smelling a stale cache, it is worth taking a step back and examining the debug architecture of the nRF54LM20. Like most Arm systems, it implements to the Arm Debug Interface (ADI), specifically leveraging the Arm CoreSight SoC-400 implementation. It has three access ports: two standard AHB-AP and one custom CTRL-AP. The first AHB-AP is used to communicate with the main Cortex-M33 CPU, while the latter is used for accessing auxiliary units, specifically the RISC-V VPR coprocessor. The aforementioned CTRL-AP enables a small subset of functionality that is typically leveraged in a scenario in which the AHB-APs have been disabled (i.e. access port protection is enabled).
In order for GDB to interact with the J-Link OB, it needs something to translate
between the commands it supports and those supported by the underlying debugger.
JLinkGDBServer
plays that role when working with J-Link debuggers. GDB effectively acts as a
consistent interface to heterogeneous backends, so when you want to read the
contents of a given memory address, you can use the same command whether you are
debugging a microcontroller or a process on your local development machine.
You can also issue commands directly to the GDB server implementation using the
the GDB monitor command. For example, JLinkGDBServer supports a ReadMemAP
command, which allows you to
directly specify the access port to target, the memory address, the number of
items, and a set of flags. Suspecting that my push operations may be succeeding,
but my reads returning stale values, I issued a ReadMemAP command with the
same parameters as my GDB memory read commands.
(gdb) monitor ReadMemAP 0x0 0x20000000 4 0
O.K.:0xDE56F4DE,0xF4DE56F4,0x56F4DE56,0xDE56F4DE
Sure enough, reading directly from the AHB-AP showed the expected value.
Furthermore, after issuing the read, subsequent examine (x) commands from GDB
continued to return stale values. GDB and JLinkGDBServer communicate using the
GDB Remote Serial Protocol
(RSP),
and the specific packets transmitted between them can be observed by enabling
remote debug logging.
(gdb) set debug remote 1
Given the observed behavior, I suspected that the two different memory read strategies used different RSP packets. This was confirmed after issuing commands with the debug logging enabled.
(gdb) x/4wx 0x20000000
[remote] Packet received: b??}\003?
0xab23c1ab	[remote] Sending packet: $x20000004,4#5e
[remote] Packet received: b?}\003??
0xc1ab23c1	[remote] Sending packet: $x20000008,4#62
[remote] Packet received: b}\003??}\003
0x23c1ab23	[remote] Sending packet: $x2000000c,4#8d
[remote] Packet received: b??}\003?
0xab23c1ab
(gdb) monitor ReadMemAP 0x0 0x20000000 4 0
[remote] Sending packet: $qRcmd,526561644d656d415020307830203078323030303030303020342030#a0
[remote] Packet received: 4f2e4b2e3a307844453536463444452c307846344445353646342c307835364634444535362c307844453536463444450D0A
O.K.:0xDE56F4DE,0xF4DE56F4,0x56F4DE56,0xDE56F4DE
In fact, the ReadMemAP command is passed hex encoded directly to
JLinkGDBServer using a qRcmd (remote command query) packet.
echo 526561644d656d415020307830203078323030303030303020312030 | xxd -r -p
ReadMemAP 0x0 0x20000000 4 0
The question of why JLinkGDBServer opted to return stale values for one read
and not the other remained. Though the documentation on JLinkArm.dll, the
underlying library that most J-Link tooling depends on, is fairly light, there
is a list of supported command
strings that gives a clue as to
its internal caching behavior. Specifically, the SetEnableMemCache
command is
defined as controlling memory caching mechanisms, and is on by default. There is
even a somewhat ominous note about turning it off.
This command may not be used by any IDE, listed as a supported IDE, to disable memory cache mechanisms by default. It may only be used by specific customers for very specific test cases that needs the cache mechanisms to be disabled.
Eager to observe if disabling the memory cache actually resulted in fresh values being returned when issuing examine commands, I once again erased the device and connected GDB. Before performing any operations, I disabled the memory cache.
(gdb) monitor exec SetEnableMemCache = 0
Running through the provision and push operations for the first slot, I observed the expected value as before. Then on the second provision and push, the examine command finally returned the updated value.
(gdb) x/4wx 0x20000000
0x20000000: 0xde56f4de 0xf4de56f4 0x56f4de56 0xde56f4de
However, as the J-Link documentations states, you typically do not want to turn
off caching. The reason why the JLinkArm.dll memory cache returns stale values
in this case is because the CPU is halted and we are attempting to read from a
memory address that we have already accessed without advancing the CPU. With the
memory cache enabled, advancing the CPU a few instructions (stepi) results in
the cache being cleared and a fresh value being returned on the next read.
Outside of use cases where a peripheral, such as the nRF54LM20’s KMU, has direct memory access (DMA) and can write while the core is halted, you typically won’t encounter issues with stale debugger memory cache values. In the event that you do, it can be helpful to understand the underlying bus architecture and how to bypass the cache by reading directly from an access port.