controller-runtime
exposes a metrics server by
default
on port
8080
for any controller
Manager.
Metrics are registered for the
client,
workqueue,
and on a per-controller
basis.
Controllers initialize
metrics
when started, and write to the registry at various points throughout operation,
such as when processing items off the
workqueue
and after completed reconciliation
loops.
If you are using a framework like Kubebuilder, it
will generate manifests for the necessary objects, such as a
ServiceMonitor,
to scrape these metrics using
kube-prometheus in your
Kubernetes cluster.
This is extremely useful, and you can easily add additional
metrics
that you want to collect, then write to those collectors in your
Reconciler
implementation. However, this can be a bit heavy-handed when developing locally,
so it would be nice to have a simpler workflow for consuming metrics when you
just want to test something out. I frequently spin up a
kind cluster and simply go run my controllers
when experimenting with new functionality. In those times, I want to have a
dashboard that I can pull up and see what is happening with my local updates.
Accessing the controller-runtime metrics in this scenario is as easy as
navigating to localhost:8080/metrics. For example, after running the following
commands in in Crossplane’s
provider-aws (assuming your
kubeconfig is already pointing to an active Kubernetes cluster):
kubectl apply -f package/crds
go run cmd/provider/main.go &
curl localhost:8080
We see the output (abridged below) of all of the collectors mentioned above:
...
controller_runtime_active_workers{controller="managed/activity.sfn.aws.crossplane.io"} 0
controller_runtime_active_workers{controller="managed/api.apigatewayv2.aws.crossplane.io"} 0
controller_runtime_active_workers{controller="managed/apimapping.apigatewayv2.aws.crossplane.io"} 0
controller_runtime_active_workers{controller="managed/authorizer.apigatewayv2.aws.crossplane.io"} 0
controller_runtime_active_workers{controller="managed/backup.dynamodb.aws.crossplane.io"} 0
controller_runtime_active_workers{controller="managed/bucket.s3.aws.crossplane.io"} 0
controller_runtime_active_workers{controller="managed/bucketpolicy.s3.aws.crossplane.io"} 0
controller_runtime_active_workers{controller="managed/cachecluster.cache.aws.crossplane.io"} 0
...
This raw output is not super consumable, and is definitely not visually
aesthetic. Fortunately, the good folks who work on Prometheus have provided an
image
on Dockerhub and
Quay that we can run locally
to make these metrics much more useful. In order for the Prometheus instance to
know where to scrape metrics from, we have to provide it with an endpoint in its
configuration
file.
Here is an extremely simple configuration that will inform Prometheus where to
get our provider-aws metrics from, as well as where to scrape metrics for its
own operations.
Note: By default, metrics are assumed to be served at the
/metricsendpoint for the supplied targets.
scrape_configs:
  - job_name: 'prometheus'
    scrape_interval: 5s
    static_configs:
      - targets: ['localhost:9090']
  - job_name: 'provider-aws'
    scrape_interval: 5s
    static_configs:
      - targets: ['localhost:8080']
The last step is to run the image with the configuration file above mounted and
host networking enabled (so that Prometheus is able to scrape the provider-aws
localhost endpoint).
Note: Remember that if you are running Docker in a VM, additional configuration will be required as the network namespace for the Docker daemon is not the same as the local network namespace that the running controller will be utilizing.
docker run -d --net=host -v path/to/your/prometheus.yml:/etc/prometheus/prometheus.yml prom/prometheus
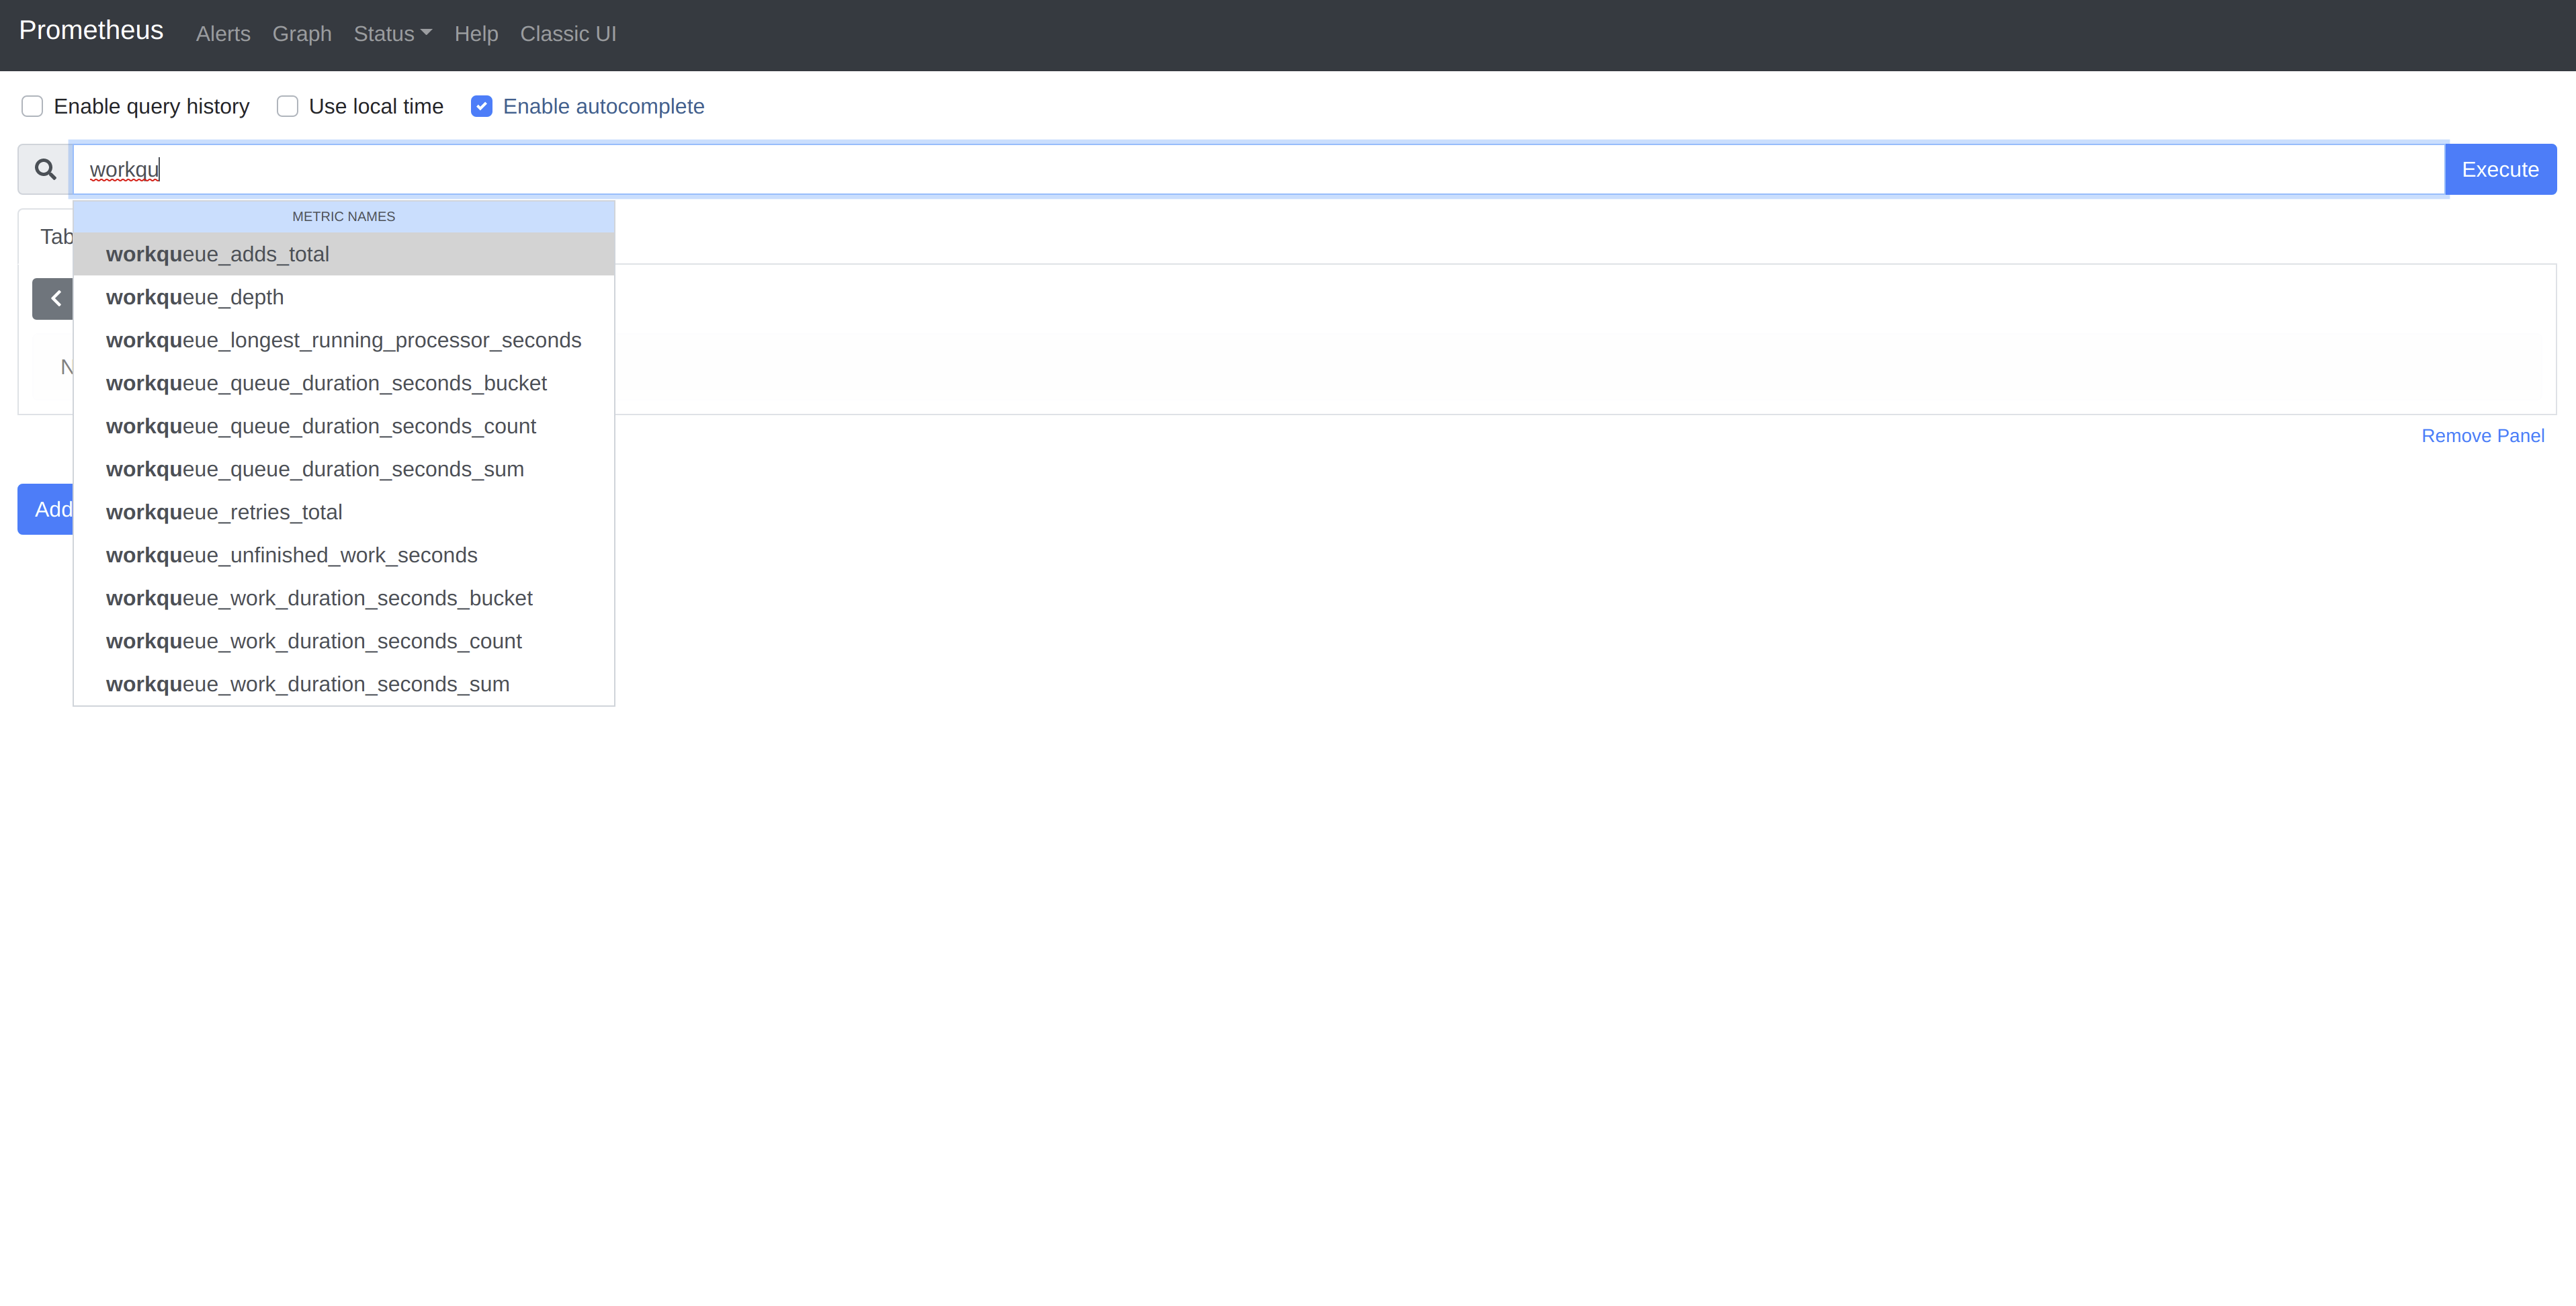
Navigate to localhost:9090 and you will be met with the Prometheus dashboard.
Typing a few characters should invoke autocomplete with some of the collectors
we saw earlier.
To see some of the metrics in action, we must trigger the watches on objects
managed by the controllers. Since we do not have provider-aws configured with
credentials, reconciling any object is going to cause failed reconciliation.
Let’s create an S3
Bucket
and see what happens:
kubectl apply -f examples/s3/bucket.yaml
In a recent
post,
I explored the controller-runtime rate limiting interface. In provider-aws,
the Bucket controller is configured with a per-item exponential backoff
limiter with a base delay of 1s and a max delay of 60s. Since our controller
is expected to continuously fail in this case, we should see the exponential
backoff represented in the graph of the workqueue_retries_total collector for
the Bucket controller.
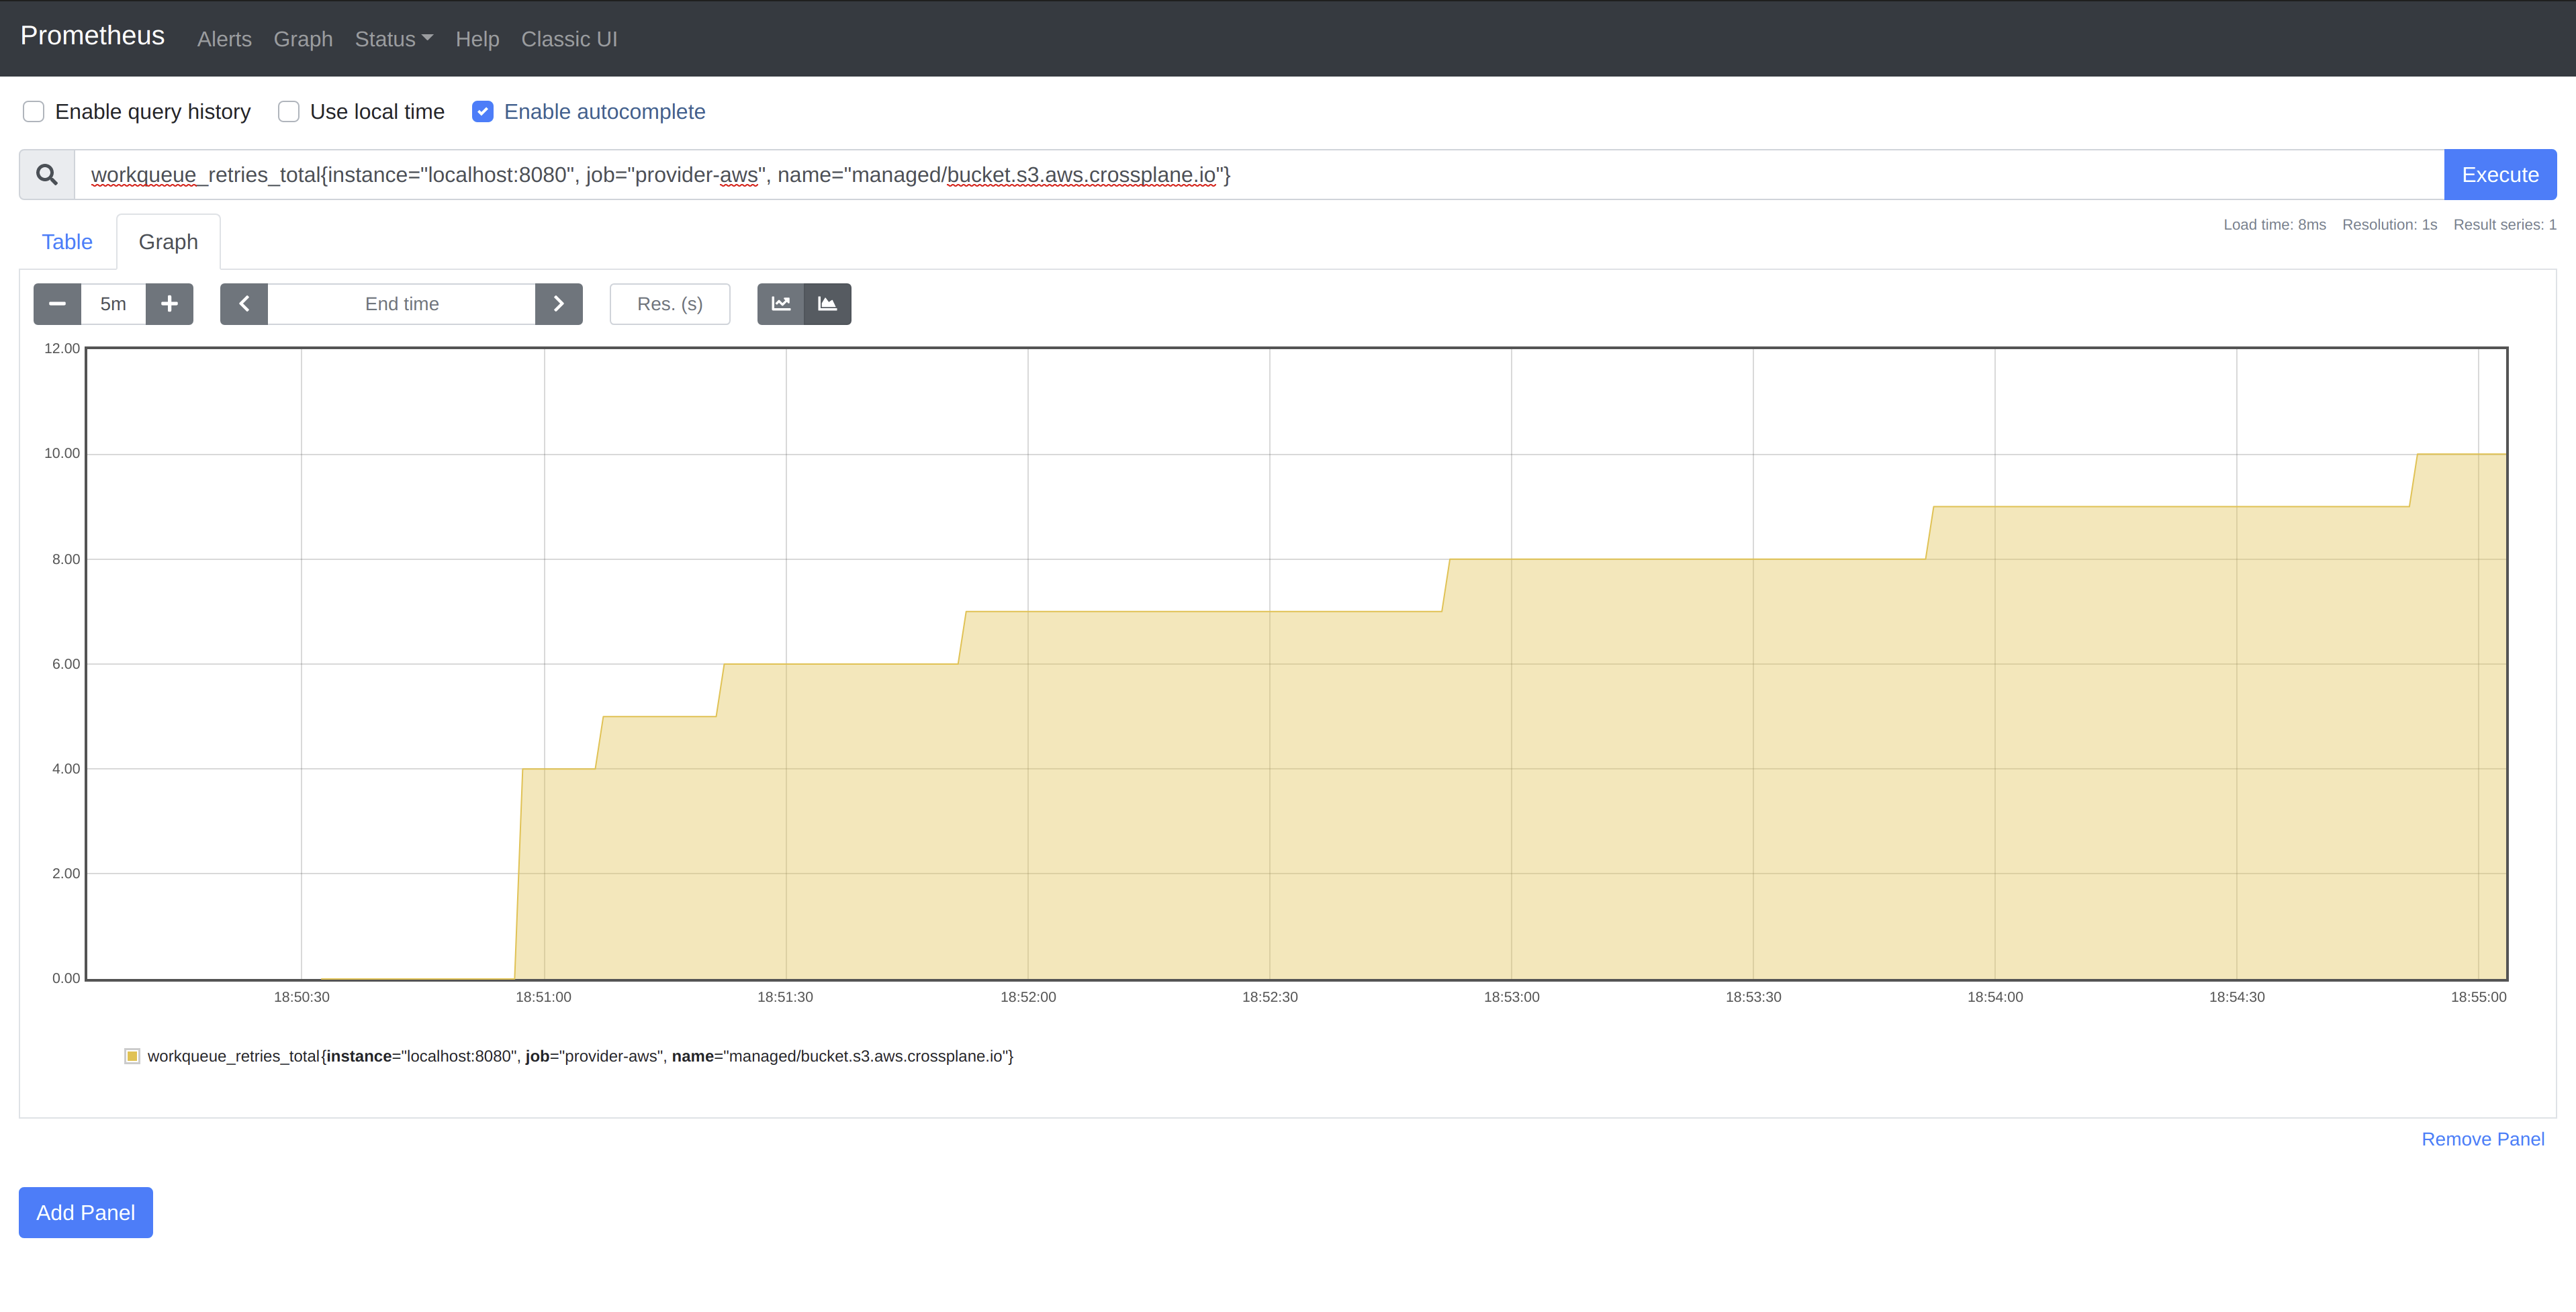
As you can see, the delay between reconciles for our single item doubles until
reaching the max delay of 60s, at which time it remains constant.
Note: You will notice the first few requeues are not reflected on the graph due to our scraping interval of
5s. This can be adjusted if more granular data is required.
While this is a somewhat trivial example, the ability to quickly view the behavior of controllers, especially when running hundreds of them under a single manager, can be extremely valuable when troubleshooting performance issues.
Send me a message @hasheddan on Twitter for any questions or comments!